I was writing a quick query the other day that showed how many people registered on a site over time. I thought that it would be nice to have a graph-like representation of this, so I didn't actually have to read the numbers.
Then I thought, what if I could do this in SQL rather than having to mess about with Excel or similar. So, within a minute I'd use the padding and replace to get a rough-n-ready bar chart. The result is below, I quite like it :)
Here's the SQL
select
    Convert(varchar,DateConfirmed,106) as Date,
    count(*) as ConfirmedRegistrations,
    replace(space(count(*)),' ','|') as Chart
from
    Operators
where
    DATEDIFF(day, DateConfirmed, GETDATE()) < 30
group by
    Convert(varchar,DateConfirmed,106)
order by
    1 desc, 2 desc
This was done in SQL Server 2005 (T-SQL), but I reckon you could do it in anything with a SPACE and REPLACE function.
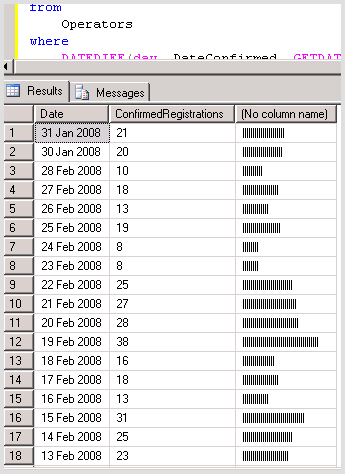
If you want to see the output rendered in text, here it is:
Date         Total       Chart
------------ ----------- ------------------------------
31 Jan 2008  21          |||||||||||||||||||||
30 Jan 2008  20          ||||||||||||||||||||
28 Feb 2008  10          ||||||||||
27 Feb 2008  18          ||||||||||||||||||
26 Feb 2008  13          |||||||||||||
25 Feb 2008  19          |||||||||||||||||||
24 Feb 2008  8           ||||||||
23 Feb 2008  8           ||||||||
22 Feb 2008  25          |||||||||||||||||||||||||
21 Feb 2008  27          |||||||||||||||||||||||||||
20 Feb 2008  28          ||||||||||||||||||||||||||||
19 Feb 2008  38          ||||||||||||||||||||||||||||||||||||||
18 Feb 2008  16          ||||||||||||||||
17 Feb 2008  18          ||||||||||||||||||
16 Feb 2008  13          |||||||||||||
15 Feb 2008  31          |||||||||||||||||||||||||||||||
14 Feb 2008  25          |||||||||||||||||||||||||
13 Feb 2008  23          |||||||||||||||||||||||
12 Feb 2008  27          |||||||||||||||||||||||||||
11 Feb 2008  17          |||||||||||||||||
10 Feb 2008  7           |||||||
09 Feb 2008  11          |||||||||||
08 Feb 2008  25          |||||||||||||||||||||||||
07 Feb 2008  25          |||||||||||||||||||||||||
06 Feb 2008  19          |||||||||||||||||||
05 Feb 2008  31          |||||||||||||||||||||||||||||||
04 Feb 2008  30          ||||||||||||||||||||||||||||||
03 Feb 2008  12          ||||||||||||
02 Feb 2008  10          ||||||||||
01 Feb 2008  15          |||||||||||||||

(30 row(s) affected)
If anyone's into visual representation of information, then I'd recommend Edward Tufte's "The Visual Display of Quantitative Information". I also frequent his cool Ask E.T blog on all things UI and design.